Prepared by Amin Momin, Hyejung Park, Brent Portz,
Alfred H. Merrill, Jr.
Copyright© 2010 & 2011
Georgia Institute of Technology
All rights reserved.
Home | Sphingomap | Sphingo-GeneMap | SOURCES | LINKS
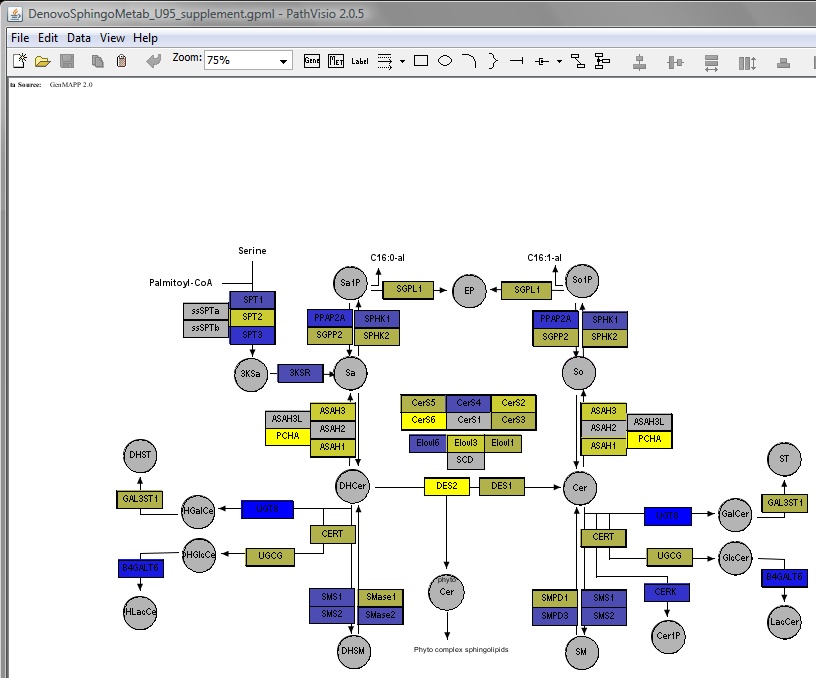
Sphingolipid and glycosphingolipid biosynthesis pathway maps
Updated pathway maps were prepared to visualize differences in gene expression and metabolites
of the sphingolipid biosynthesis pathway using an open acess pathway browser, Pathvisio v1.1.
The modifications in the maps include newly discovered gene isoforms and metabolite brances as
reported in the current literature and summarized in BMC systems biology.
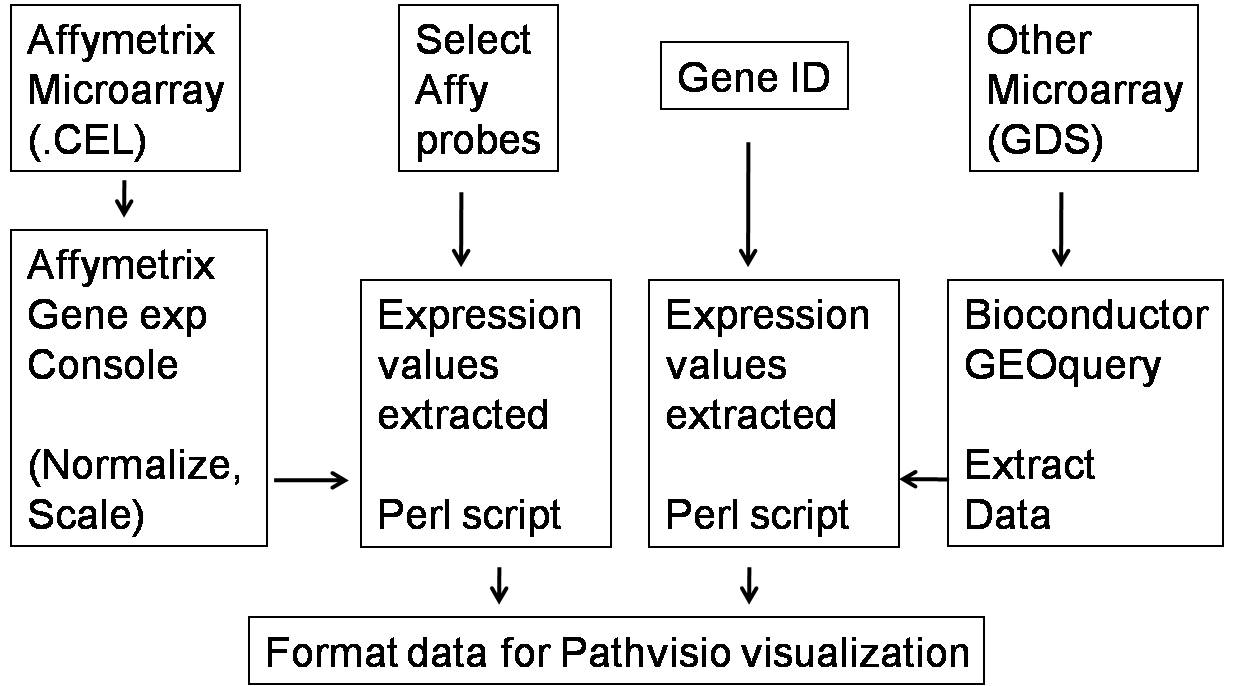
The procedure involved in the selection and extraction of gene expession datasets for the
preparation of the pathway maps are displayed in the flow diagram (Fig 1).The individual
step involved in the preparation of the pathway diagrams are elaborated in the tutorial.
The tutorial below describes the steps required to visulaize gene expression differences
using a sample microarray dataset. Details for preparation of pathway maps from raw affymetrix
datasets (.CEL files) are discussed in the later section
skip to Preparation of Expression Datasets from Raw Microarray Data File.
PathvioTutorial
Download Pathvisio browser, and gene and metabolite databases (latest version):The Browser Software and the Human Genome and Metabolite Databases should be downloaded
from www.Pathvisio.org (van Iersel et.al , BMC Bioinformatics. 2008 Sep 25;9:399).
Separate downloaders are required to be downloaded for the databases prior to thier download.
Java Virtual Machine should be installed prior to running Pathvisio browser and downloading
databases.
Importing Gene Expression Values:
1) Pathvisio Permits Data Application and Editing of Pathway Map Files. Such files
for the Different Branches of the Sphingolipid Biosynthesis are included:
Human Pathway: click on the links below and saves the files as '.gpml' in pathways folder.
2) A Sample Microarray Dataset is Provided to Prepare Pathway Maps within Pathvisio:
Differential gene expression between basal and luminal breast cancer cell lines
(GSE12777: Hoeflich et. al, Clin Cancer Res 2009 Jul 15;15(14):4649-64.)
Download the file and save as .csv format in the pathvisio folder.
3) Pathvisio Requires the Conversion of the Microarray Dataset to a Specific File.
To Create the Expression Data File:
Open the downloaded pathway map in Pathvisio browser.
From the File menu -> Open and then choose the downlaoded map (.gpml file).
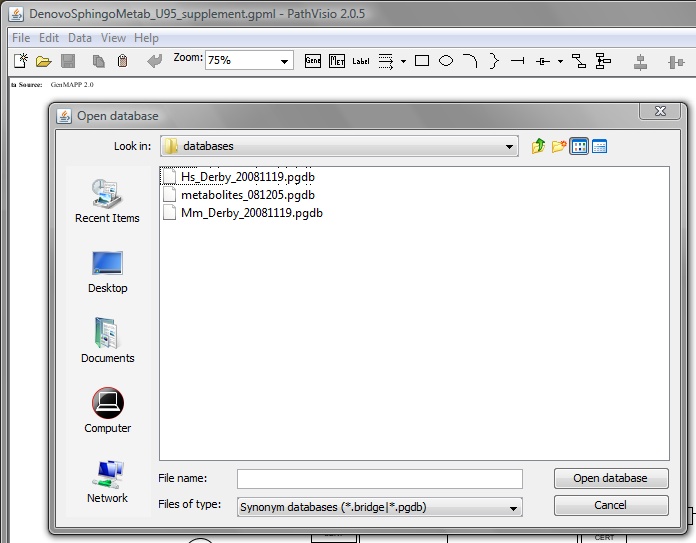
Select human gene database (The latest version)
From the Data menu -> Gene Database -> Databases (choose human Hs_Derby_20xx.pgdb).
From the Data menu -> Import Expression Data
Within 'Expression data import wizard' Select the Input file (previously prepared .csv file)
and a default output file is selected (.pgex).
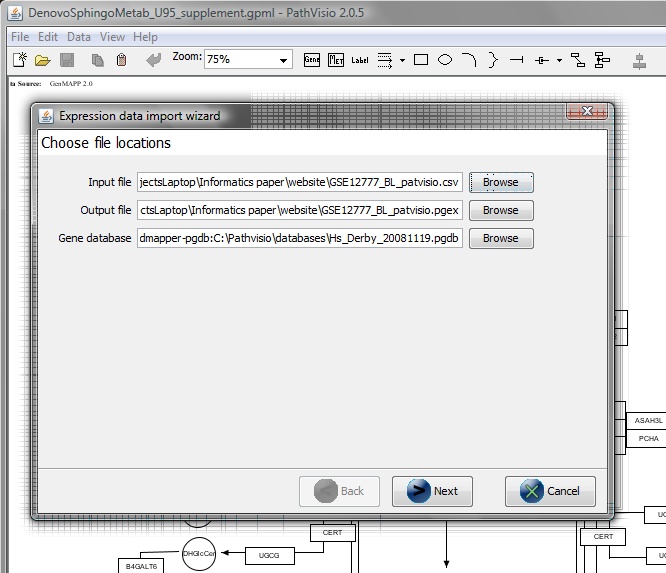
Choose Data Delimiter -> Comma -> Next
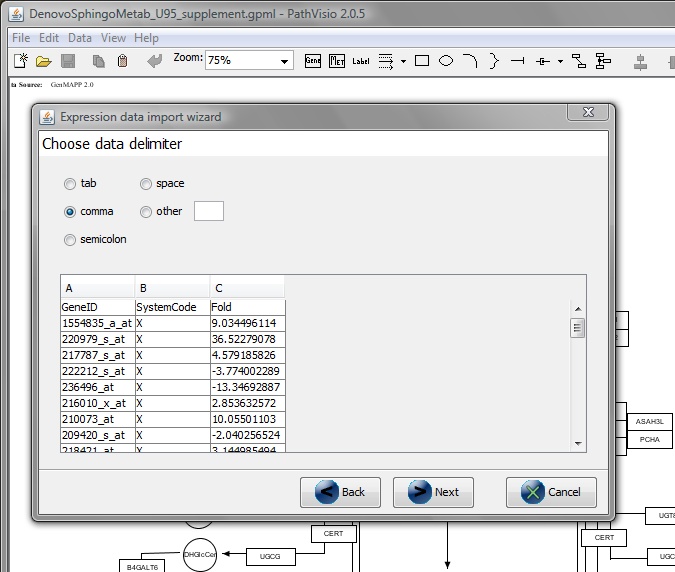
From 'Select primary identifier column' -> GeneID.
From 'Select a column to specify system code' -> SystemCode.
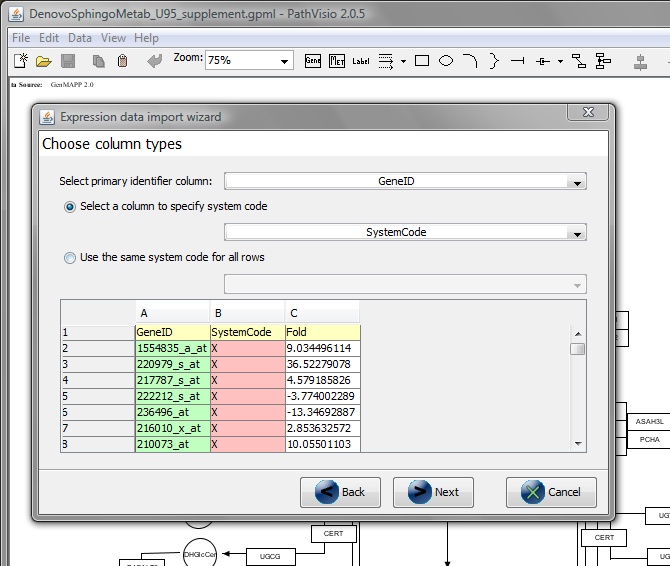
Click Finish.
Pathvisio expression file (.pgex) is created from the excel file (.csv) and is
used in the next step.
4) The Created Expression File is used to Visualize Data witin Pathvisio. To Visualize
Expression Values:
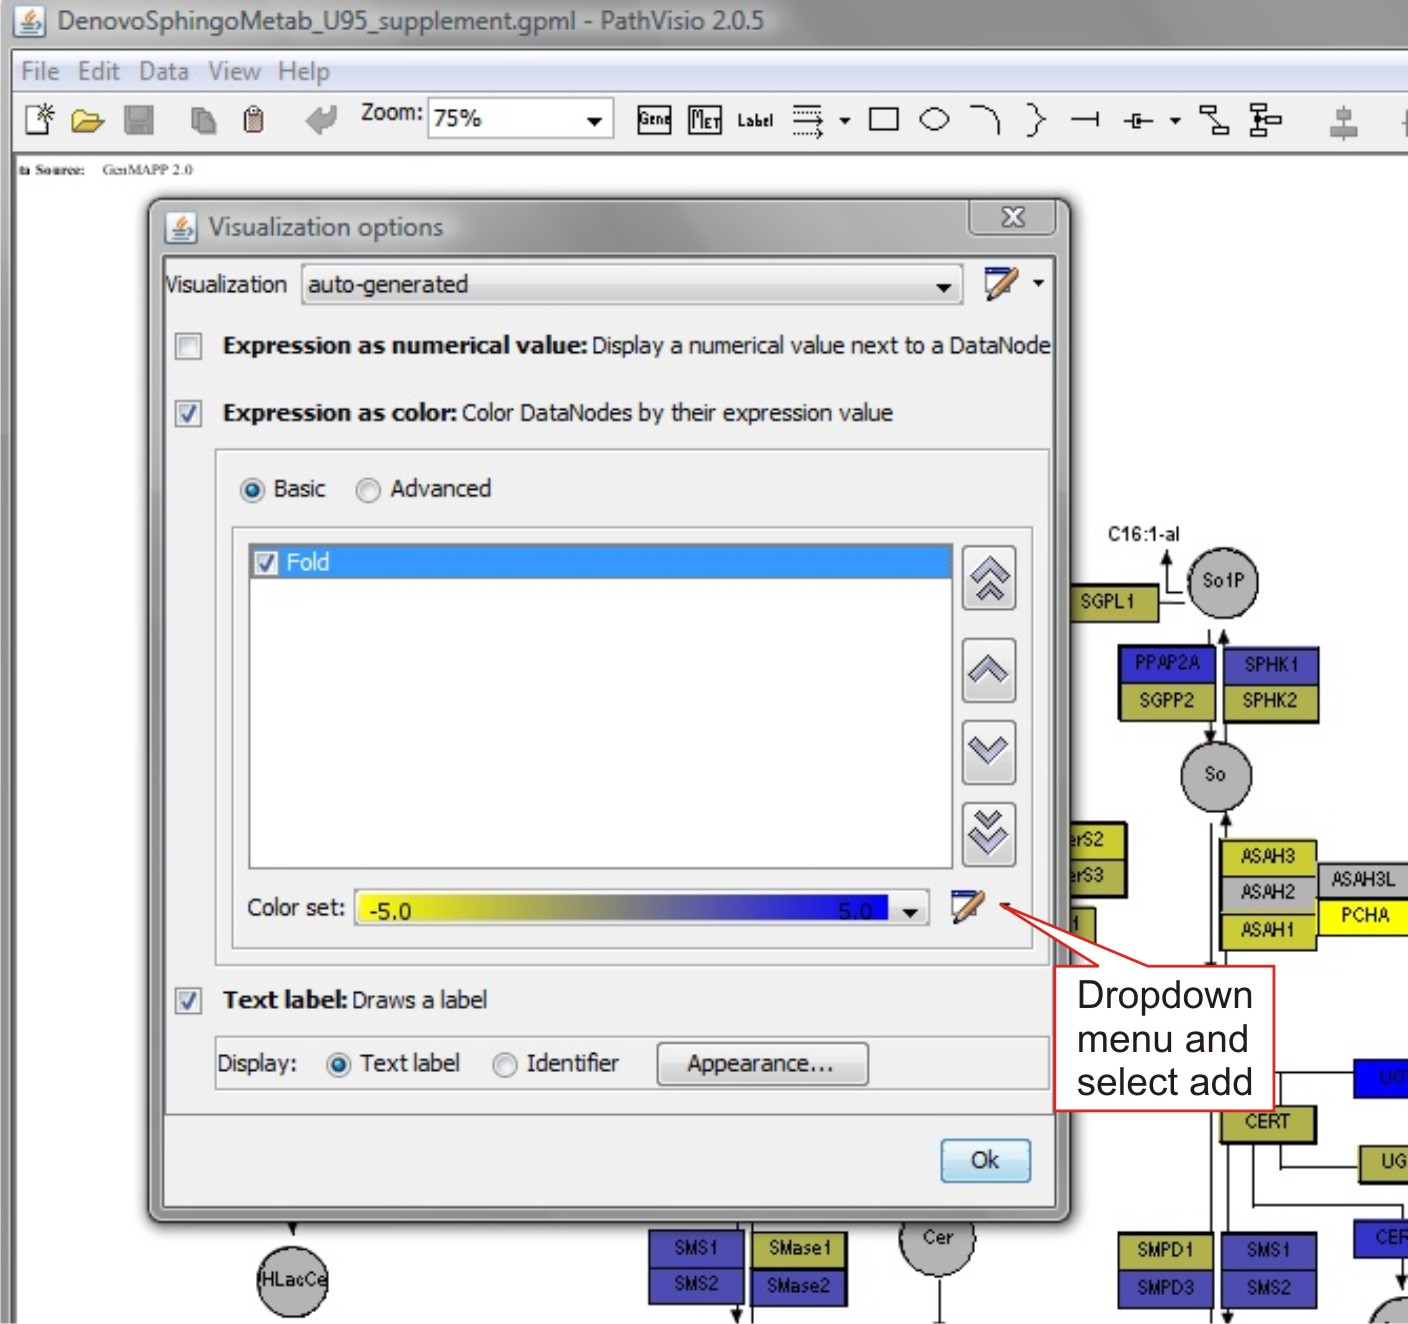
From the menu select Data -> Select Expression Dataset (choose the .pgex file)
Select Data -> Visualization Options
From 'Visualization' -> Auto-generated.
Select 'Expression as Color'.
To modify color gradient:
Select the drop-down menu in ' Color Set' -> 'New'
In the Edit color set dialog box, Select 'Gradient' and specify values i.e. -5 (min)
to 5.0 (max) -> Select 'OK'.
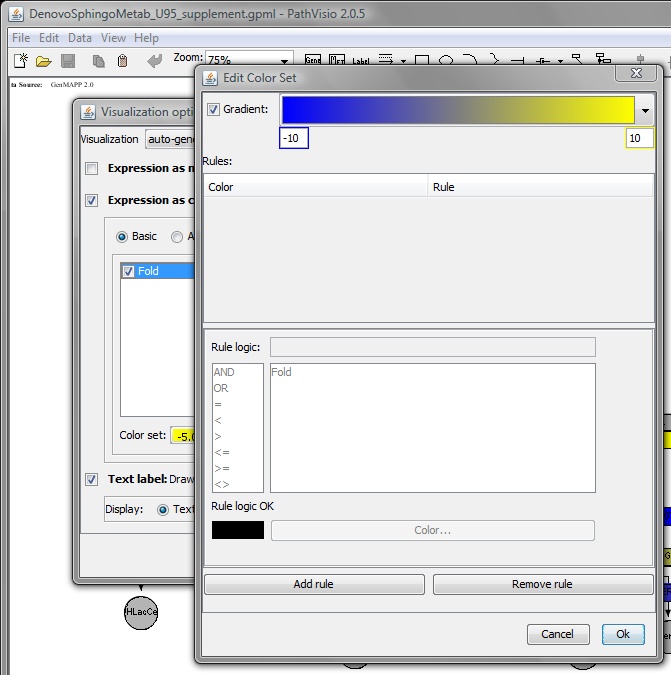
Upon completion the map should be colored according to the selected criteria.
Importing Metabolite Changes as nodes in pathway maps:
1) Add metabolite differences to template file.
Open the template file using microsoft excel and fill in the available fold change values (the third column).
(Metabolite Template)
Leave the unkown values as '1' and delete the column (last) listing the metabolite annotations.
For new metabolites not included in the template make sure to assign the objects the same ID (name)
as the GeneID.
2) Copy and paste the formatted template into the gene expression file fold change file.
Select the first three columns of the template file and paste them at the bottom of the pathvisio
gene expression file (previously formated .csv file).
Save the pathvisio expression file as a new .csv file and follow the instruction as previously
described for visulization of gene expression values (Step 4-Importing Gene Expression Values).
Preparation of Expression Datasets from Raw Microarray Data File
Steps 1-4 describe the process involved in preparation of pathvisio espression file
from affymetrix .CEL file obtained from published datasets or in house studies. To prepare
expression files from previously normalized datasets obtained as text or .xls files,
skip to Sphingolipid Gene Extraction
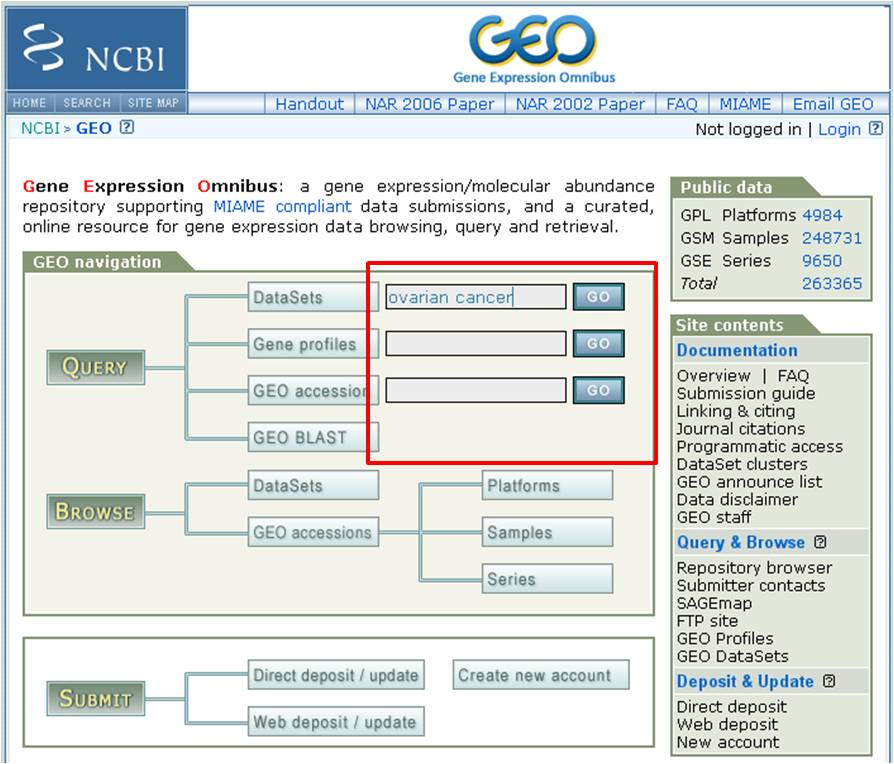
1) Expression Datasets from Major Repositories can be used within Pathvisio. To Obtain
Public Gene Expression Datasets, Search:
NCBI GEO (Note: Download http)
ArrayExpress
Oncomine (Note: Free for academic use)
Perform a keyword search for the appropriate gene expression dataset in NCBI GEO
either with disease/cancer type or the experiemnt ID provided in a publication.
Download the apprpriate .CEL file (affymetrix experiments) or the GDS file
for other platforms or cDNA array datasets.
To Normalize Raw Gene Expression files:
Unzip/Extract and Store Affymatrix .CEL file
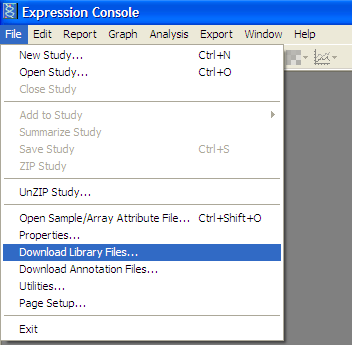
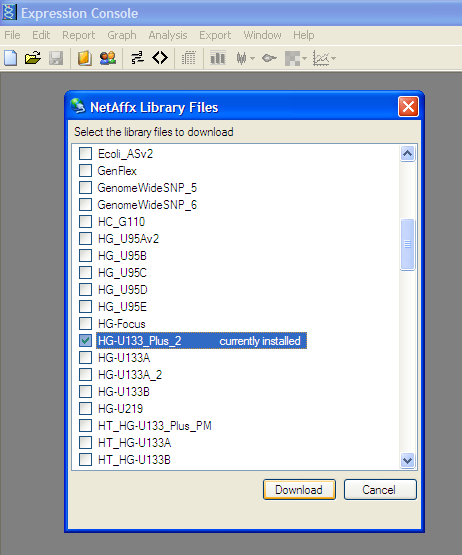
Download Affymatrix Gene Expression Console to normalize Affymatrix expression values:
Create free user account (Note: Compatible with PC only)
Download Library file for Affymatrix chip:
From the File menu -> "Download library files
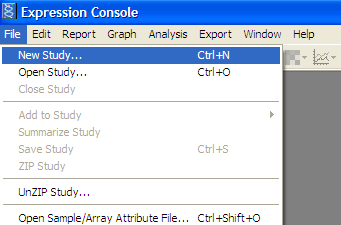
Create new study to analyze CEL files:
From File menu -> New Study
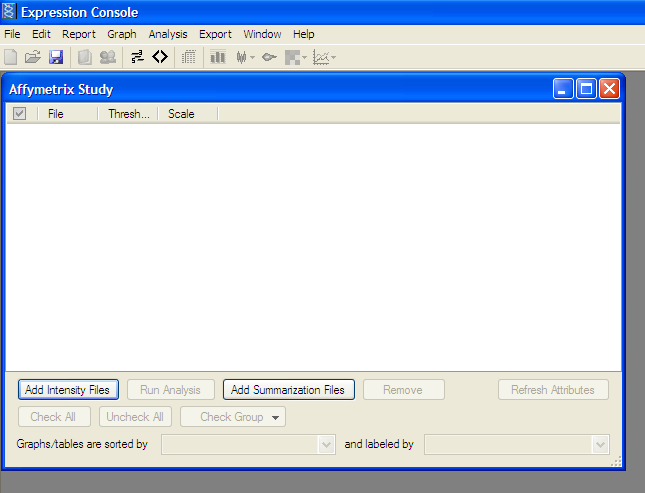
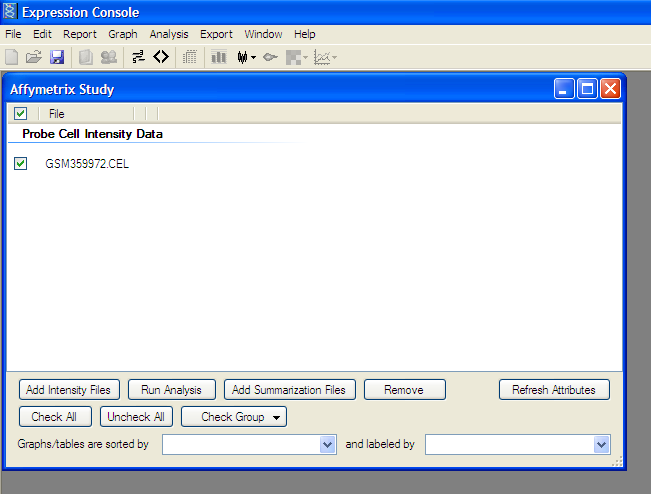
Add extracted .CEL files from data set -> Add Intensity Files button:
Add all files to be analyzed.
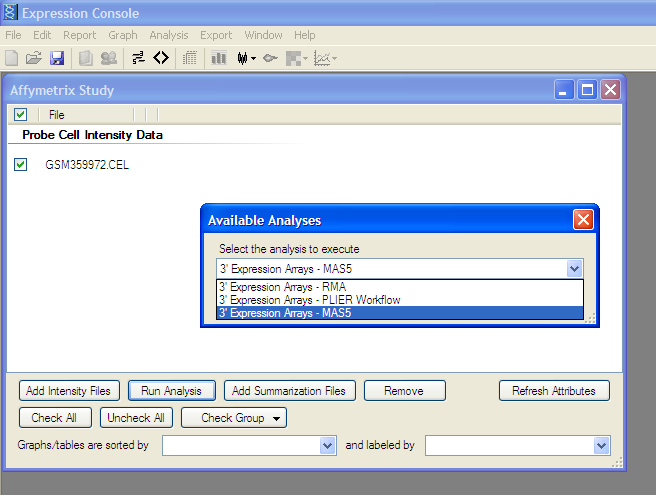
Analyze Selected File:
Click Run Analysis button and Select appropriate 3 Expression Array (MAS5, RMA, or PLIER)
as described in study
Affymatrix chip has been normalized and dataset is ready to export to external file
3) Results from Affymatrix Data Normalization can be Exported to an External File (.cvs)
used by Pathvisio. In Affymatrix Gene Expression Console:
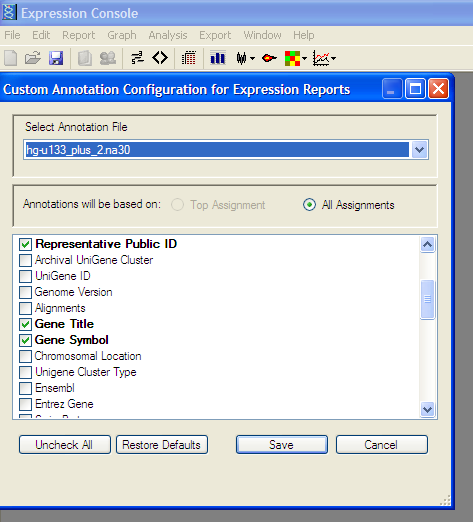
Download Gene Annotation file corresponding to Affymatrix chip used:
From File Menu -> Download Annotation Files
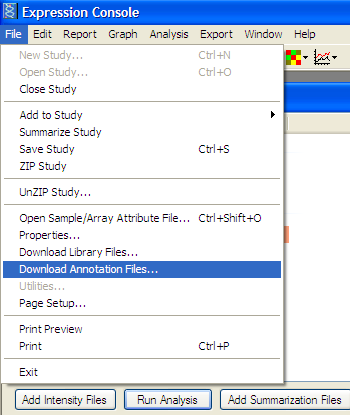
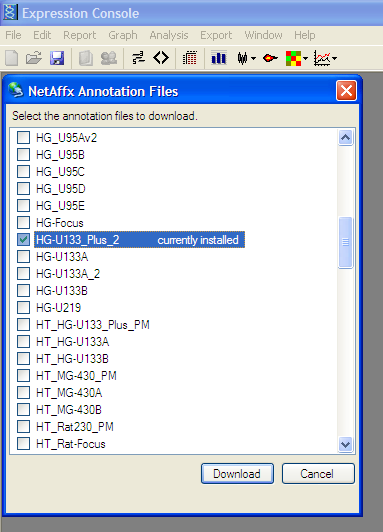 Select appropriate chip and Download
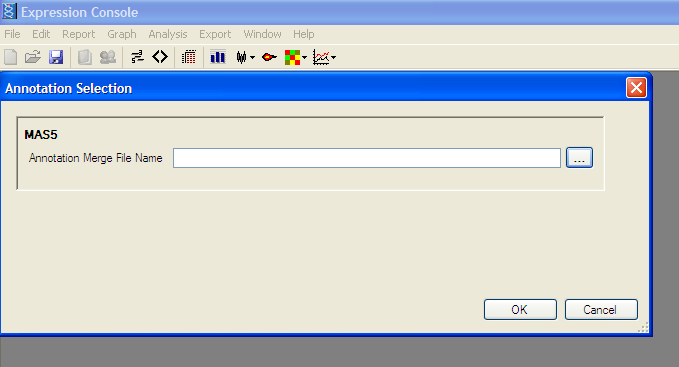
Merge Annotation file with expression results:
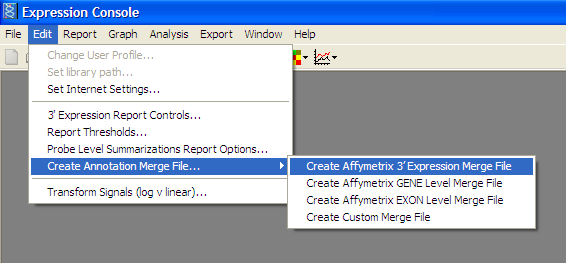
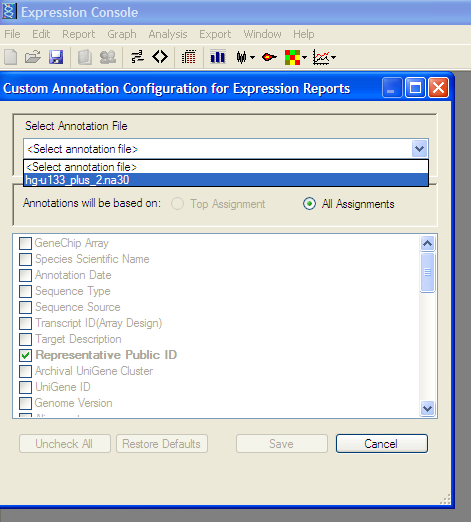
From the Edit menu -> Create Annotation Merge File -> Create Affymatrix 3 Expression Merge File
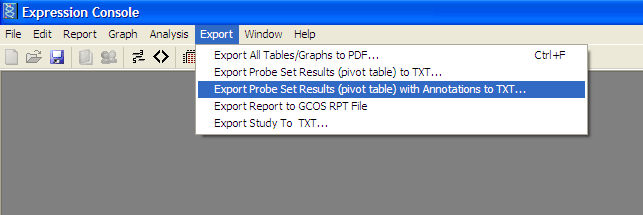
Export Results to Comma Separated Value (.CSV) File:
From the Export Menu-> Export Probe Set Results (pivot table) with Annotations to TXT
4) .CSV File has been created for Pathvisio
Extraction of gene expression values pertinent to the sphingolipid biosynthesis pathway
Download the script for extraction of expression values corressponding to probes specific to
the sphingolipid biosysnthesis pathway and save it as a perl (.pl) file.
Perl script to extract expression values
The list of gene ID's or their preselected probes for affymetrix HG-U133 Plus2 or HG-U95
chipset can be obtained from the link below.
GENE ID List
Affy HG-U133 Plus2
Affy HG-U95
On windows PC install the Activeperl package from www.Activestate.com. (Perl is already installed on
Mac OS in the X-terminal). Copy and paste the above script into a text editor (notepad) and save
it as genefilter.pl in a separate folder. Next copy and paste the list of gene IDs and probe IDs
in another separate text file and save them as shingogene.txt or sphingoprobe.txt in the same
folder as the Perl script. Save the normalized microarray dataset with gene expression values and
gene ID (or affymetrix probe IDs) in a tab delineated text file in the folder along with the gene/probe
list and the Perl script files. To filter the sphingolipid related gene expression values from all
the microarray gene probes run the Perl script on the command line (as shown in the figure below
for windows PC).
c:\perl> perl genefilter.pl microarrayfile.txt sphingogene.txt > microarraysphingo.txt
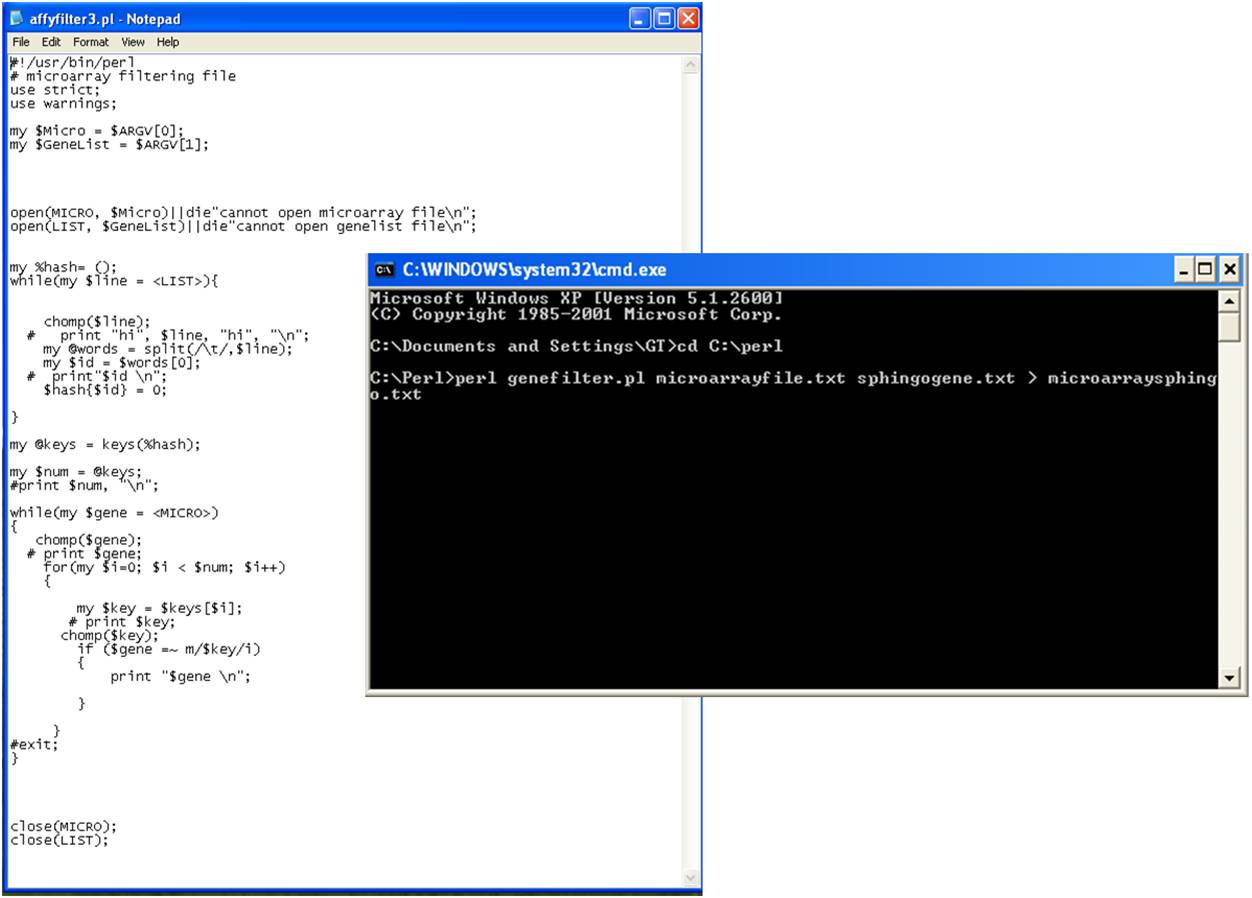
The script generates an output text file microarraysphingo.txt with the selected sphingolipid
gene expression values, which is used to prepare pathvisio input dataset file.
Formatting the expression values into a expression file
Gene expression data for sphingolipid specific genes extracted with the perl Script should be
formatted into a pathvisio input file with three essential columns and saved as a comma
separated file (.csv).
An example is given below
GeneID SystemCode Fold
1552833_at X -1.143967291
1552903_at X 1.010328449
1552965_a_at X 1.422851697
1553046_s_at X 1.220136212
1553257_at X 1.113669687
1553727_at X 4.407868628
1553959_a_at X 1.83540546
1554053_at X -2.338778491
1554253_a_at X 1.068452133
1554383_a_at X 1.139011527
1554835_a_at X 2.045004684
1555123_at X 2.645276048
1555171_at X -1.123596112
1555419_a_at X -2.284137975
GeneID - is the gene identifier or probe ID
SystemCode - type of gene identifier
Fold the calculated fold change for the specific gene probe.
Further information about the tile format can be obtained from www.pathvisio.org.
The file can be used to prepare pathvisio expression dataset as described in the previous section.